
The people or groups establishing ‘norms’ generally have social power (either through numbers or authority) which makes them automatically prejudiced. Normally you would turn to statistics to help inform societal norms but the issue here is that any statistical study of deviance is already prejudiced by our societal norms.
Who decides that drug-use is more interesting, statistically, than toe-length? Or number of eyelashes? Or people who eat carrots. And what if we measure the wrong things?
Statistics are, therefore, useful to study a deviance but not all that useful to determine it. But there are a couple of familiar tools which can help study a deviance once it has been determined by social means.
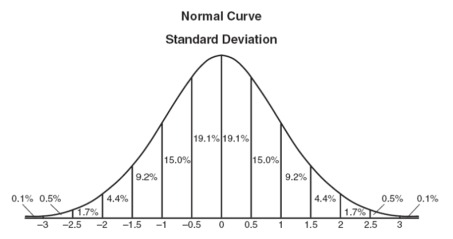
Bell Curve is curved in shape because there are outliers (on either end) that bend the straight line of normalcy downwards from where it would be if the chart were simply comprised of the masses. The middle of a bell curve is as close to ‘normal’ as you will ever get.

Standard Deviation measure – statistical convention that a certain space out (either less or more) from the centre is one standard deviation and that same again is two standard deviations and so on. The further from the centre you go the further from statistically ‘normal’ you are.
Either way, it’s clear to see it’s a numbers game. If you’re not with the masses then you’re a varying degree of ‘outlier’. Which… I have to say thank GOD for diversity!
Taken from The Great Courses’ Explaining Social Deviance Lecture 1: Asking the Right Questions
#LearnSomethingNewEveryDay